dregndrop-v2 / README.md
Dregndrop v2
dreg and not drag
Dregndrop v2
dreg and not drag
An interactive pivot table builder and data visualization dashboard designed to be embedded within other applications via iframe. It allows users to create custom pivot tables through an intuitive dreg-and-drop interface, apply dynamic filters, and generate insightful charts - all without requiring SQL knowledge or technical expertise. Perfect for data analysts and business users who need to explore and analyze data independently.
Embedded Deployment: This application is embedded in members.ecensus.gov.om. It supports optional authorization that can be enabled or disabled based on deployment requirements.
Problem Statement
Data analysts and business users often struggle with accessing and visualizing data from databases without technical expertise. They rely on pre-built reports or need to request custom queries from technical teams, creating bottlenecks and delays. This project centralizes data access through an intuitive dreg-and-drop interface, allowing users to build custom tables, apply filters, and generate visualizations independently, improving efficiency and empowering self-service analytics.
Screenshots
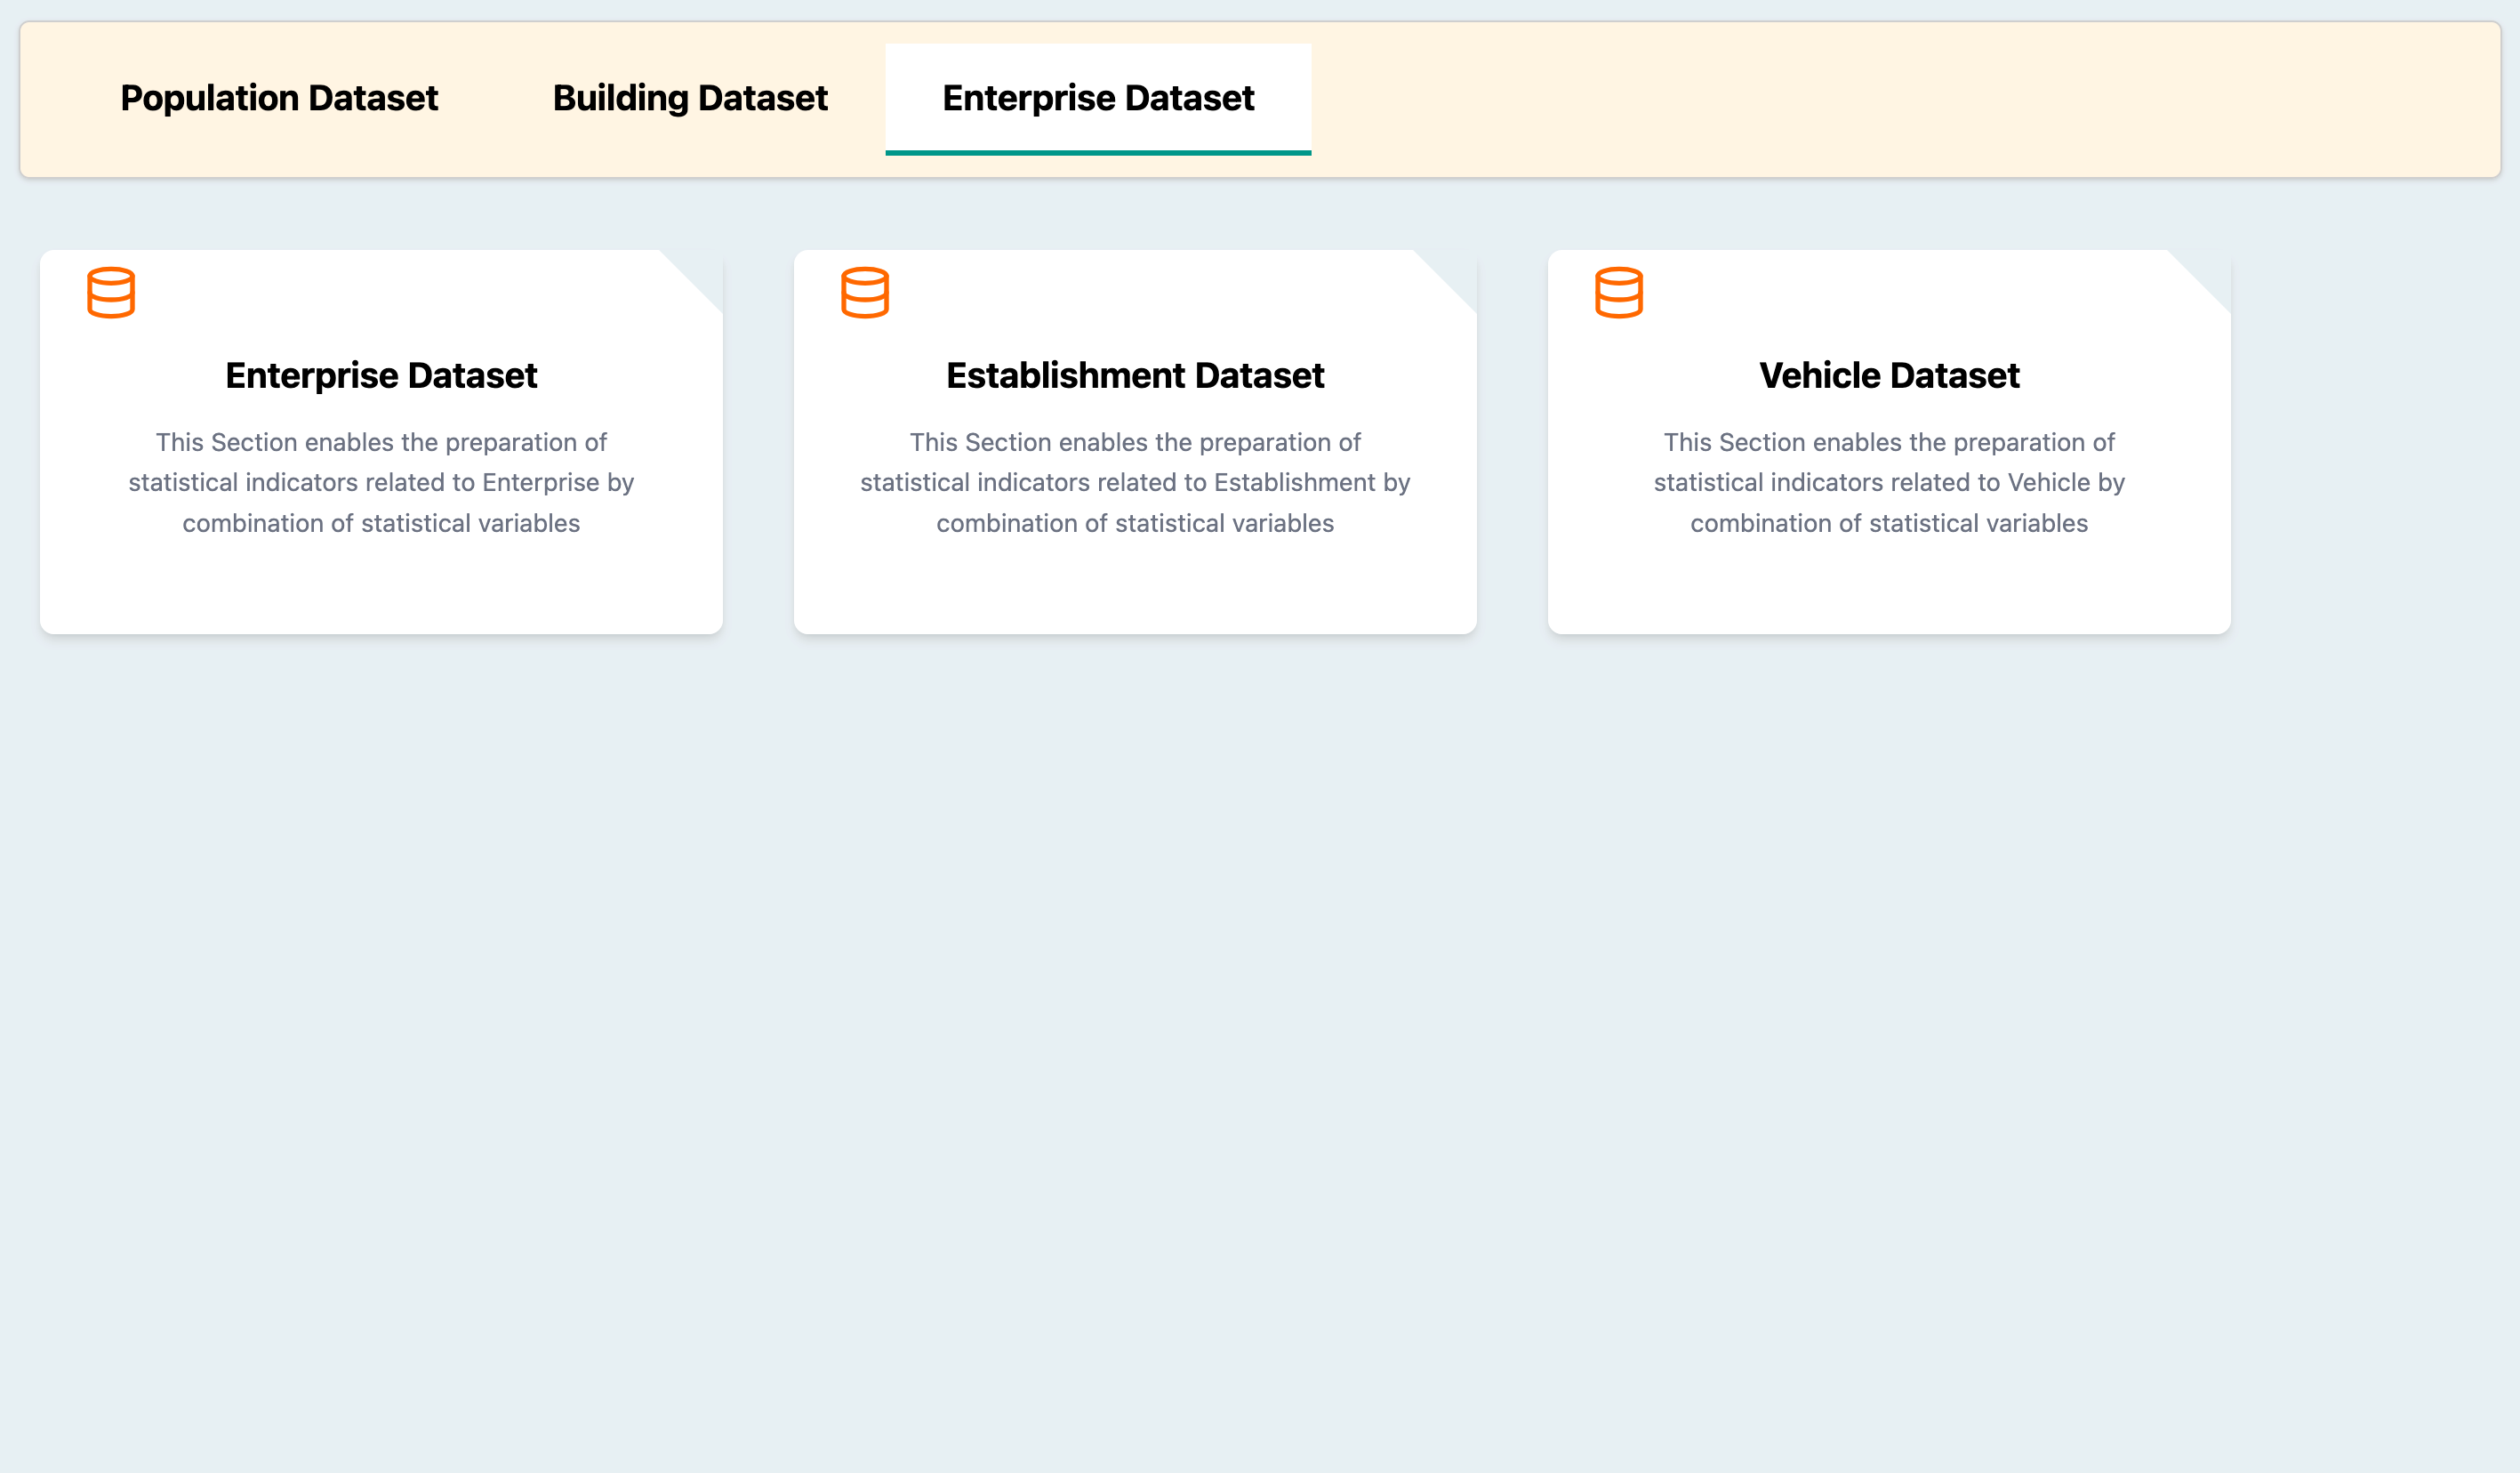
Dataset Selection Dashboard
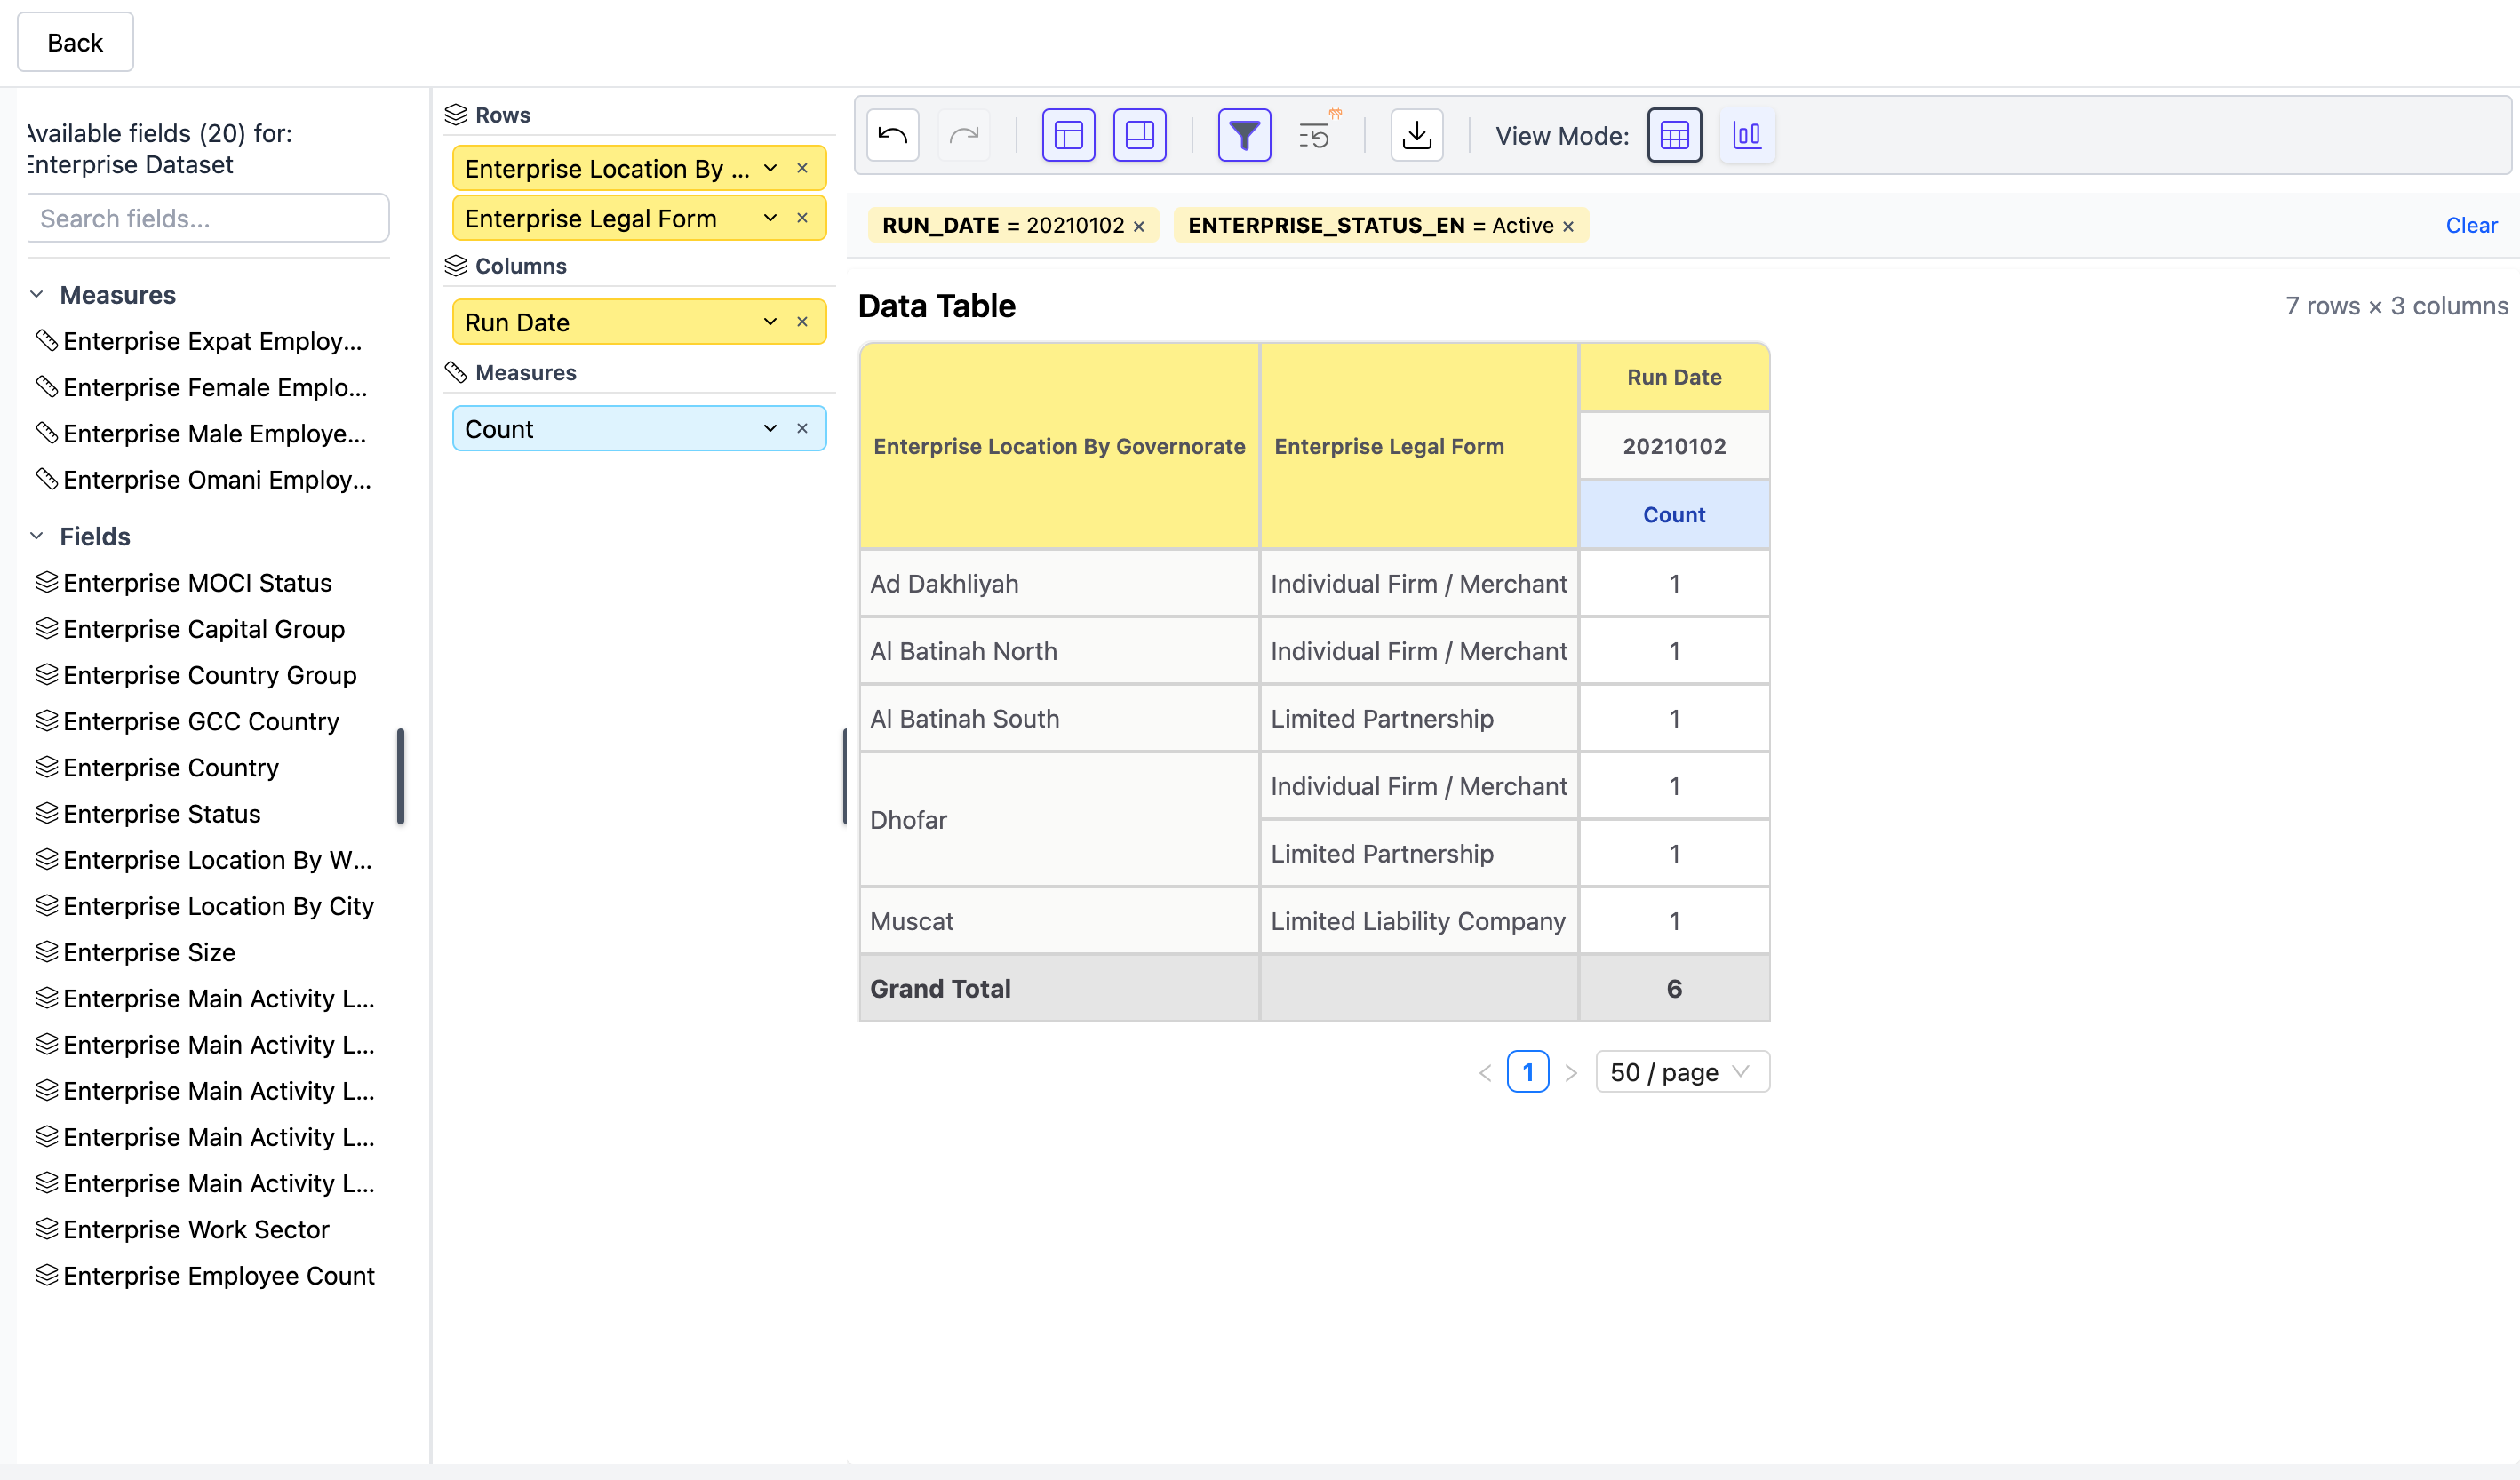
Dreg-and-Drop Pivot Table Builder
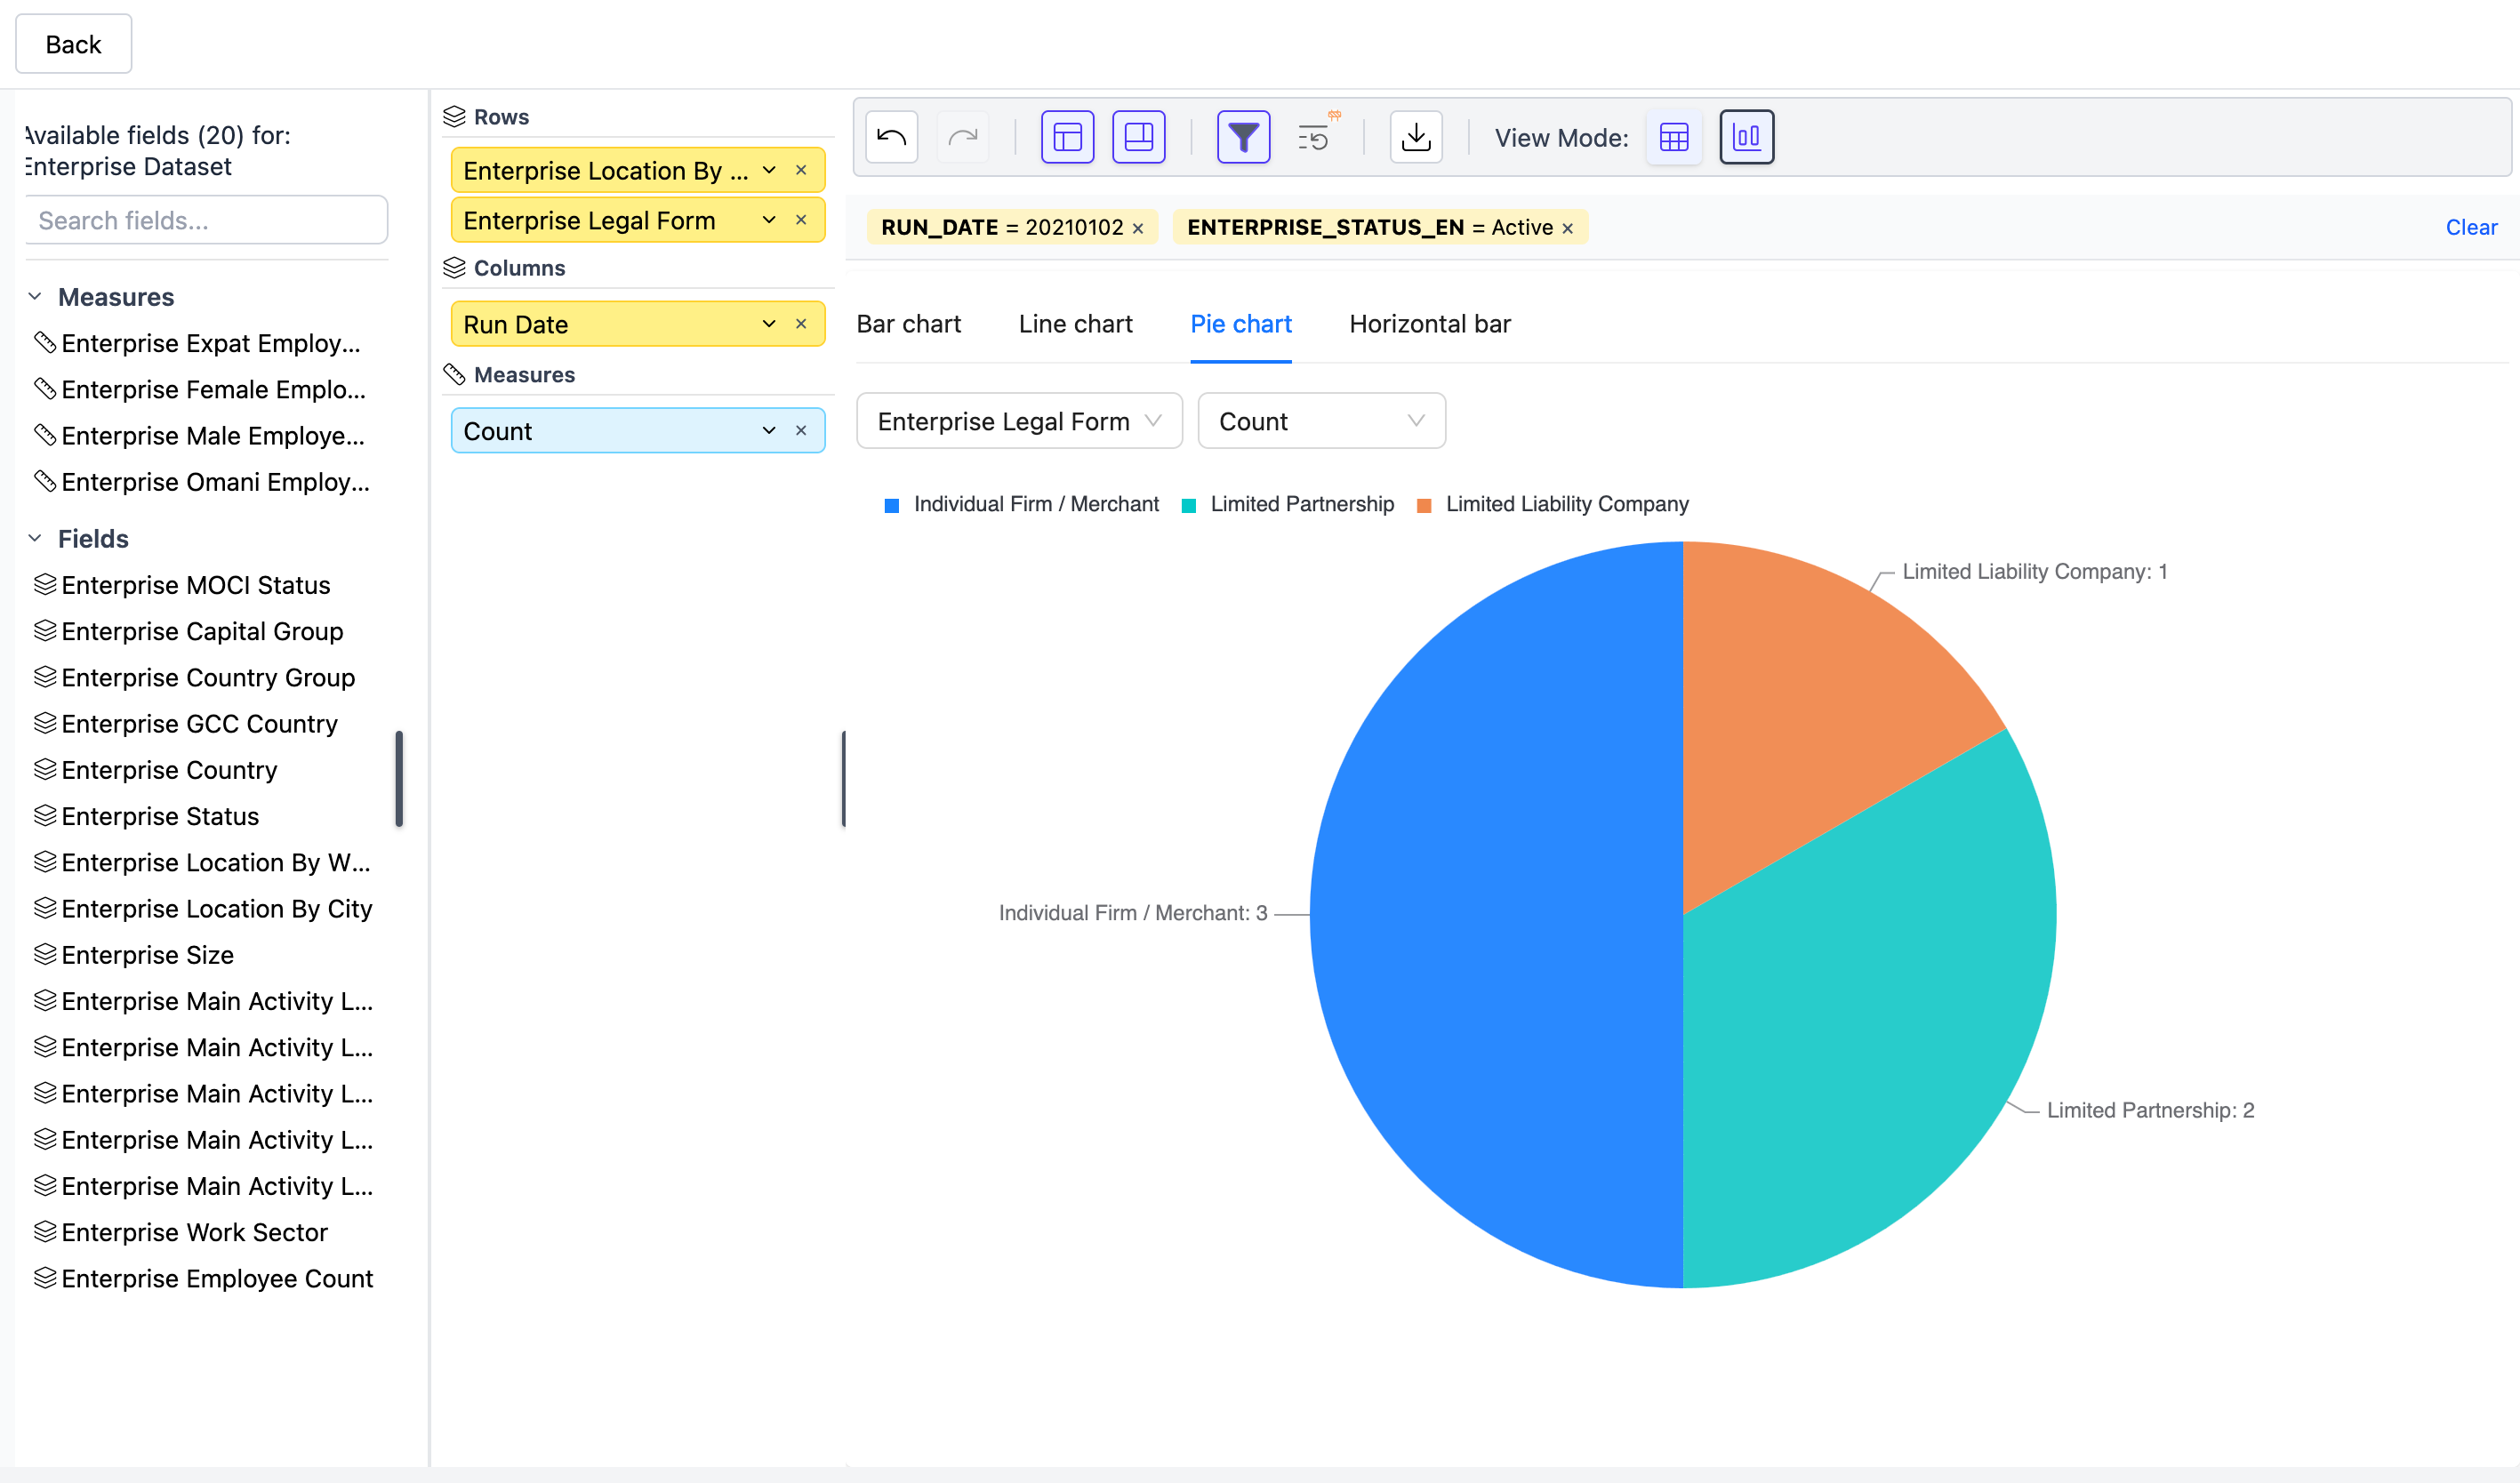
Interactive Chart Visualizations
Getting started
Pre-requisites
Project setup
Clone the repository
git clone https://github.com/rihal-om/dregndrop-v2.git
cd dregndrop-v2
Running the app locally
- Start the application using docker-compose in detached mode
docker-compose up -d
- Monitor container logs:
# View logs for a specific container
docker-compose logs -f dregndrop-web
docker-compose logs -f dregndrop-server
docker-compose logs -f dregndrop-oracle-xe
- Once the application is running, open your browser and navigate to:
# Frontend
http://localhost:3000/dregndrop

# Backend API
http://localhost:8081
Note: The Oracle database initialization takes a few seconds on first startup. Wait for the health check to pass before the application becomes fully available.
Language Support
The application supports both English and Arabic with full RTL (Right-to-Left) support:
- English:
http://localhost:3000/dregndrop?lang=en - Arabic:
http://localhost:3000/dregndrop?lang=ar
Application Features
- Pivot Table Builder: Create custom pivot tables by dregging and dropping fields - similar to Excel pivot tables but with database-backed data
- Embeddable: Designed to be embedded in other applications via iframe with optional authorization support
- Dynamic Filtering: Apply filters to your data in real-time
- Chart Visualizations: Generate pie charts, bar charts, and line charts from your pivot tables
- Multi-language Support: Full English and Arabic support with RTL layout
- Export Capabilities: Export your pivot tables to Excel format
What is a Pivot Table?
A pivot table is a data summarization tool that automatically sorts, counts, and totals data stored in a database. It allows you to:
- Group data by different dimensions (e.g., by date, category, location)
- Aggregate values (sum, count, average)
- Reorganize and summarize selected columns and rows to obtain desired insights
- Visualize trends and patterns in large datasets
This application brings the power of pivot tables to your database with an easy-to-use dreg-and-drop interface.
Further Documentation
For development guidelines, production deployment, and API documentation, see docs/README.md.
For further info contact the team